


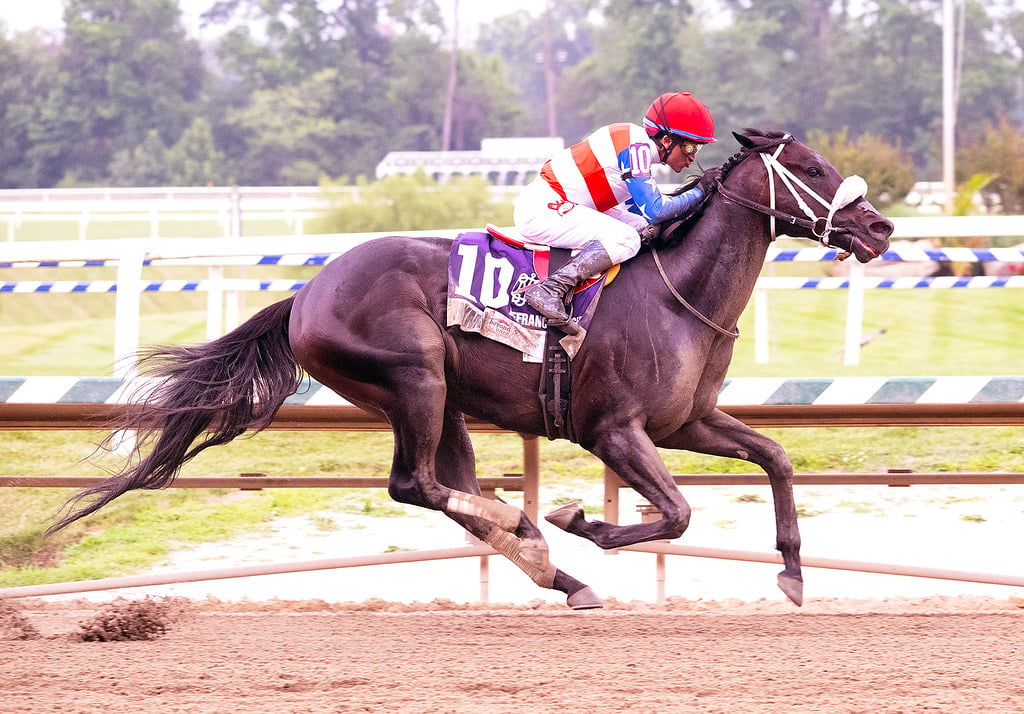


Nationwide wagering handle, purses, and race days declined in July versus the same month a year ago, Equibase Company reported. For the year to date, those figures remain slightly behind those through the end of July 2013.
Nationally, wagering declined by about $32 million in July versus July 2013 — about 3.5 percent. Purses were down about $6 million, or 5.7 percent. Because race days were down about 2.5 percent, those figures narrow somewhat on a per-day basis; on that latter basis, handle was off about one percent and purses, 3.3 percent.
For the year, the story is somewhat similar. Year-to-date wagering is down nearly 2 percent, with purses off 1.3 percent. With nearly 2 percent fewer race days than a year ago, however, that means that, on a per-day basis, wagering and purses are essentially flat this year through July versus last year in the same timeframe.
One regional factor has been the failure of Colonial Downs to run this year. That by itself eliminates 25 racing days (out of a drop of 58 nationwide so far this year) and more than $14 million in handle.
Still, while the news isn’t as bad as it could be, it’s certainly not good. Nationwide handle has declined nearly 30 percent since 2003, and nearly 45 percent adjusting for inflation. While it appears that the worst of the blood-letting has stopped — handle has been essentially flat since 2011 following four consecutive years of 5 percent-plus declines — the industry remains struggling to find its financial footing.
July 2014 vs. July 2013
| Indicator | July 2014 | July 2013 | % Change |
| Wagering on U.S. Races* | $891,333,737 | $923,357,487 | -3.47% |
| U.S. Purses | $103,592,533 | $109,823,081 | -5.67% |
| U.S. Race Days | 517 | 530 | -2.45% |
YTD 2014 vs. YTD 2013
| Indicator | YTD 2014 | YTD 2013 | % Change |
| Wagering on U.S. Races* | $6,400,833,040 | $6,528,915,765 | -1.96% |
| U.S. Purses | $616,986,501 | $625,206,248 | -1.31% |
| U.S. Race Days | 2,903 | 2,961 | -1.96% |
* The wagering data includes worldwide commingled wagering on U.S. races.