



October wagering handle up, but…
Both days of Breeders’ Cup fell in October
 The Biz
 November 5, 2026

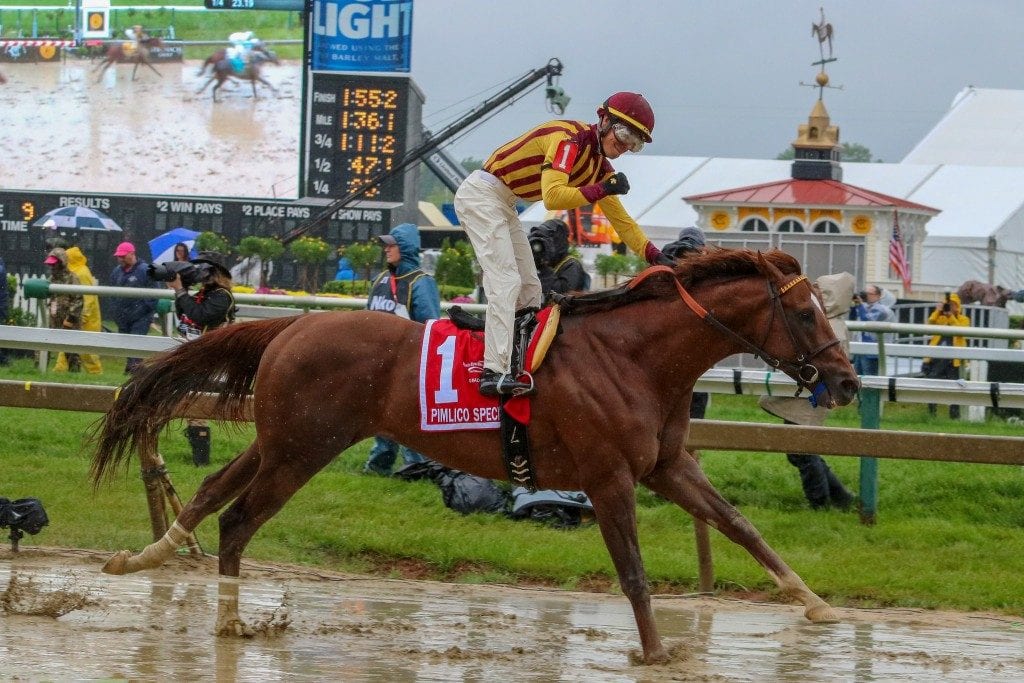
The good news in Thursday’s release of Thoroughbred racing economic indicators is that Oct. 2026 handle was up about $90 million from Oct. 2025. The less good? That bump is primarily due to Breeders’ Cup Saturday, which saw over $114 million wagered, having fallen in October this year versus November a year ago.
Wagering on U.S. races totaled $958.7 million in October, up 10.41% from $868.3 million a year earlier, according to figures released by Equibase. The totals include worldwide commingled wagering on U.S. races.
This article contains affiliate links. If you click and buy, we may earn a commission at no extra charge to you.
Pick up reliable and rewarding tickets for major events!
Breeders’ Cup Saturday’s 12-race card generated $114.3 million in common-pool wagering, more than the month’s entire year-over-year increase. Subtracting that card’s handle from October’s total leaves $844.4 million, about 2.75% below October 2025: a rough illustration of the calendar effect, rather than a comparison adjusted for all differences in racing schedules.
The calendar shift also complicates the year-to-date picture. Through October, wagering totaled $9.29 billion, down 2.71%, or $259.1 million, from the same period last year. This year’s total includes both Breeders’ Cup days; last year’s comparable period did not yet include Saturday.
Despite the October handle increase, the supply of racing continued to contract. Race days declined 1.97% to 298, while races fell 1.44% to 2,459. Starts dropped more sharply, falling 3.46% to 18,530.
That left average field size at approximately 7.54 horses, down from 7.69 a year earlier. Average wagering per race day rose 12.64% to $3.22 million.
Purses posted substantially larger October gains. Available purses rose 28.21% to $148.1 million, while purses paid increased 28.09% to $140.2 million. Available purses per race day averaged $496,872, up 30.79% from $379,899.
Through the first 10 months, purses remained ahead of last year even as wagering and racing activity declined. Available purses totaled $1.12 billion, up 2.96%, while purses paid reached $1.07 billion, a 3.01% increase.
Those dollars were spread across fewer racing opportunities. Year-to-date race days fell 2.83% to 3,052, and races declined 3.04% to 24,765. Starts were down 5.57% to 178,740, with average field size slipping from 7.41 to 7.22.
Average wagering per race day was essentially flat, rising 0.12% to $3.04 million. Average available purses per race day increased 5.96% to $368,064.
November’s report will provide a clearer comparison of wagering trends once both years’ totals include the full Breeders’ Cup weekend.

Pick up reliable and rewarding tickets for major events!
LATEST NEWS